Information
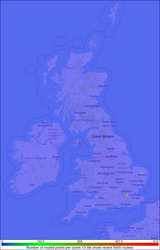
The statistics on this page represent approximately the most recent 5000 routes that have been requested from the UK routing example.Route Points
The start, middle and end locations of routes that have been calculated are plotted in the following map. Click map for a larger image.
|
Transport Types
The router offers a number of different transport types and the following diagram shows the percentage of routes for which each transport type has been selected.| Foot | 21.6 % | |
| Horse | 0.6 % | |
| Wheelchair | 0.3 % | |
| Bicycle | 4.1 % | |
| Moped | 3.2 % | |
| Motorcycle | 5.1 % | |
| Motorcar | 46.3 % | |
| Goods | 8.9 % | |
| HGV | 8.8 % | |
| PSV | 1.1 % | |
| Scale | 100.0 % |
Journey Types
The router allows selection of either the shortest route or the quickest route and the following diagram shows the percentage of routes for which each optimiser type has been selected.| Quickest | 48.2 % | |
| Shortest | 51.8 % | |
| Scale | 100.0 % |